Diagnostics center: from slow website to useful evidence
Use SHM Diagnostics Center to connect HTTP timing, application stack, PHP errors, MySQL activity, logs and bounded repairs into one diagnosis.
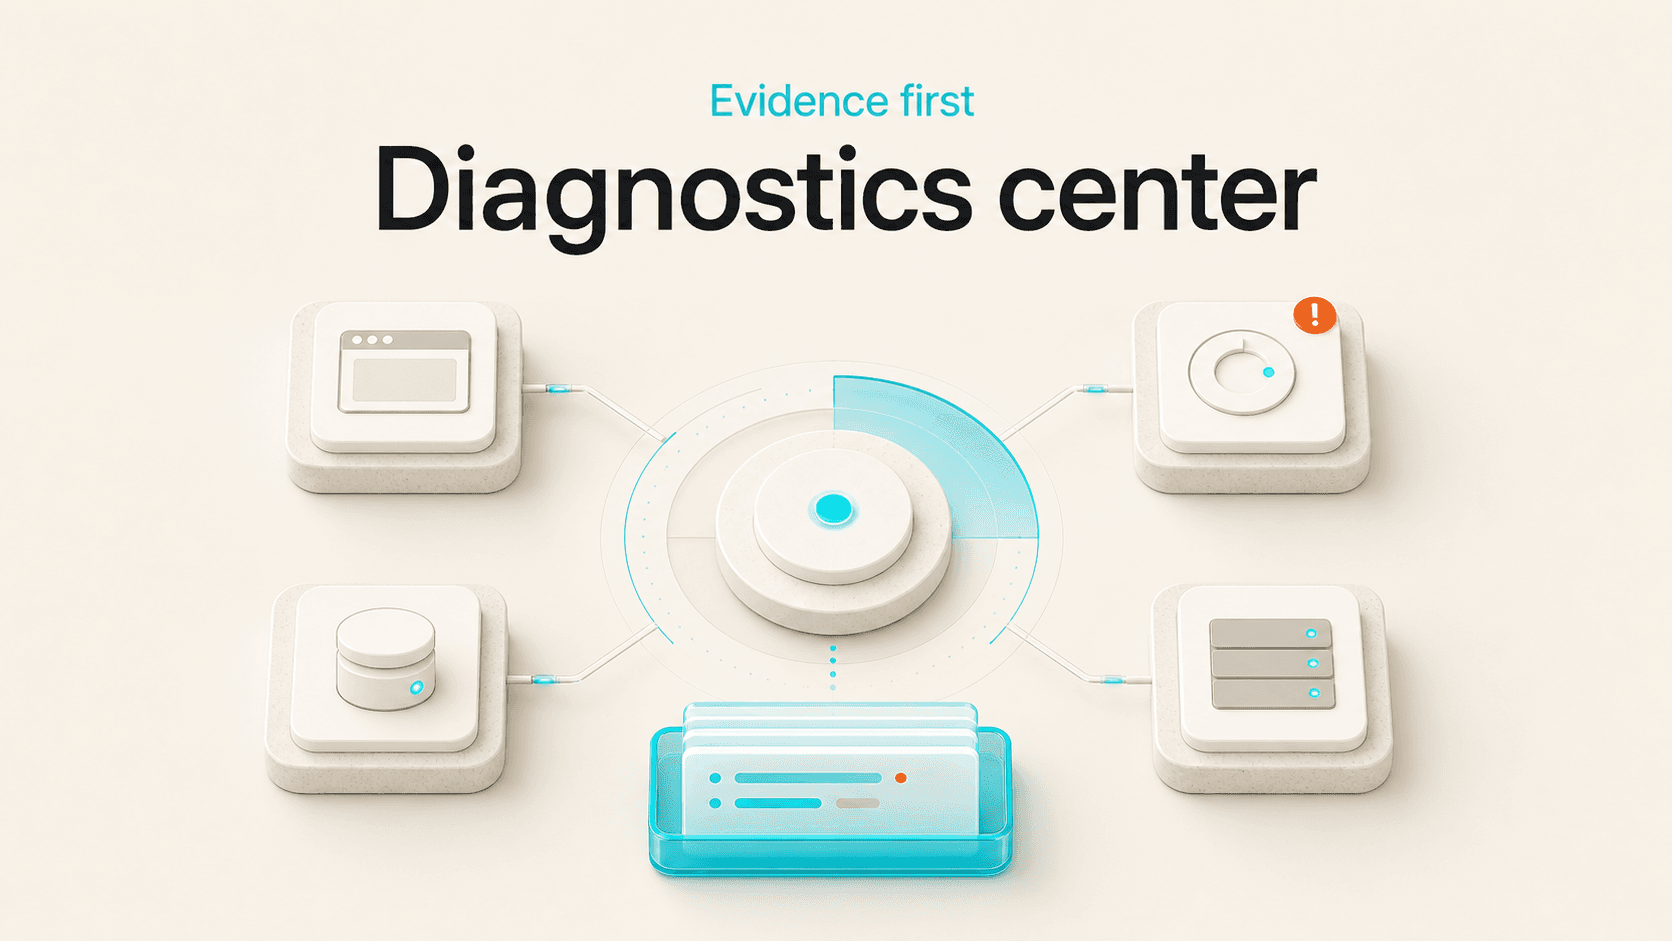
Combine HTTP timing, application stack, PHP errors, database activity and logs into a bounded diagnosis with safer repair paths.
Start with the HTTP response
A website can return 200 and still be slow, misrouted, or quietly filling an error log. Diagnostics Center begins with an HTTP probe that records status, effective URL, timing, remote address, and content type, then relates that response to the domain and document root managed by the account.
This resolves a common support ambiguity in which the browser and customer report different outcomes. Timing and routing evidence provide a more useful starting point.
Follow the application through its layers
The center summarizes the detected application stack, recent PHP errors, database activity, access status codes, and relevant error patterns. A slow response beside busy database activity tells a different story from a fast backend response followed by repeated application errors.
Top PHP error patterns are grouped so the same warning repeated thousands of times does not become thousands of separate clues. Access and error summaries are bounded to the account and domain under review.
Use evidence before making a recommendation
Diagnostics Center turns observed conditions into practical recommendations: review a failing route, inspect a recurring PHP error, check active database work, or open the relevant log. It does not claim that every correlation is a root cause. The evidence remains visible so an operator can decide whether the recommendation fits the incident.
That restraint matters. Increasing memory is not a universal remedy, and clearing cache is not a substitute for diagnosis.
Keep deeper checks bounded
SHM also exposes deeper account diagnostics to authorised workflows, including targeted HTTP probes, log summaries, configuration mismatch checks, bounded code search, application checks, and permission-repair previews. These capabilities are used by the panel and AI Mode without giving a model or browser an unrestricted filesystem search.
Repair flows distinguish preview from apply where a change can affect files or permissions. File-change operations use current-state checks, and supported repair sessions can record what changed so rollback remains targeted rather than becoming a full-account restore.
Create a fact base support can share
The final value is not the number of checks. It is the shared fact base they create. A customer can report the domain, status, timing, and visible error pattern. Support can inspect the same account-scoped evidence and continue from there instead of beginning with a new round of guesses. Diagnostics Center makes troubleshooting calmer by narrowing the problem before anyone changes the system. That is often the fastest fix available: first discover which problem you actually have.